For several months, we at ROI Hunter have been writing about how retailers can enhance the algorithms of social sites in order to incentivise Facebook to promote more items, optimise for specific goals with Google Smart Shopping, and otherwise ensure that your most profitable products are receiving the level of promotion they deserve.
Product Insights
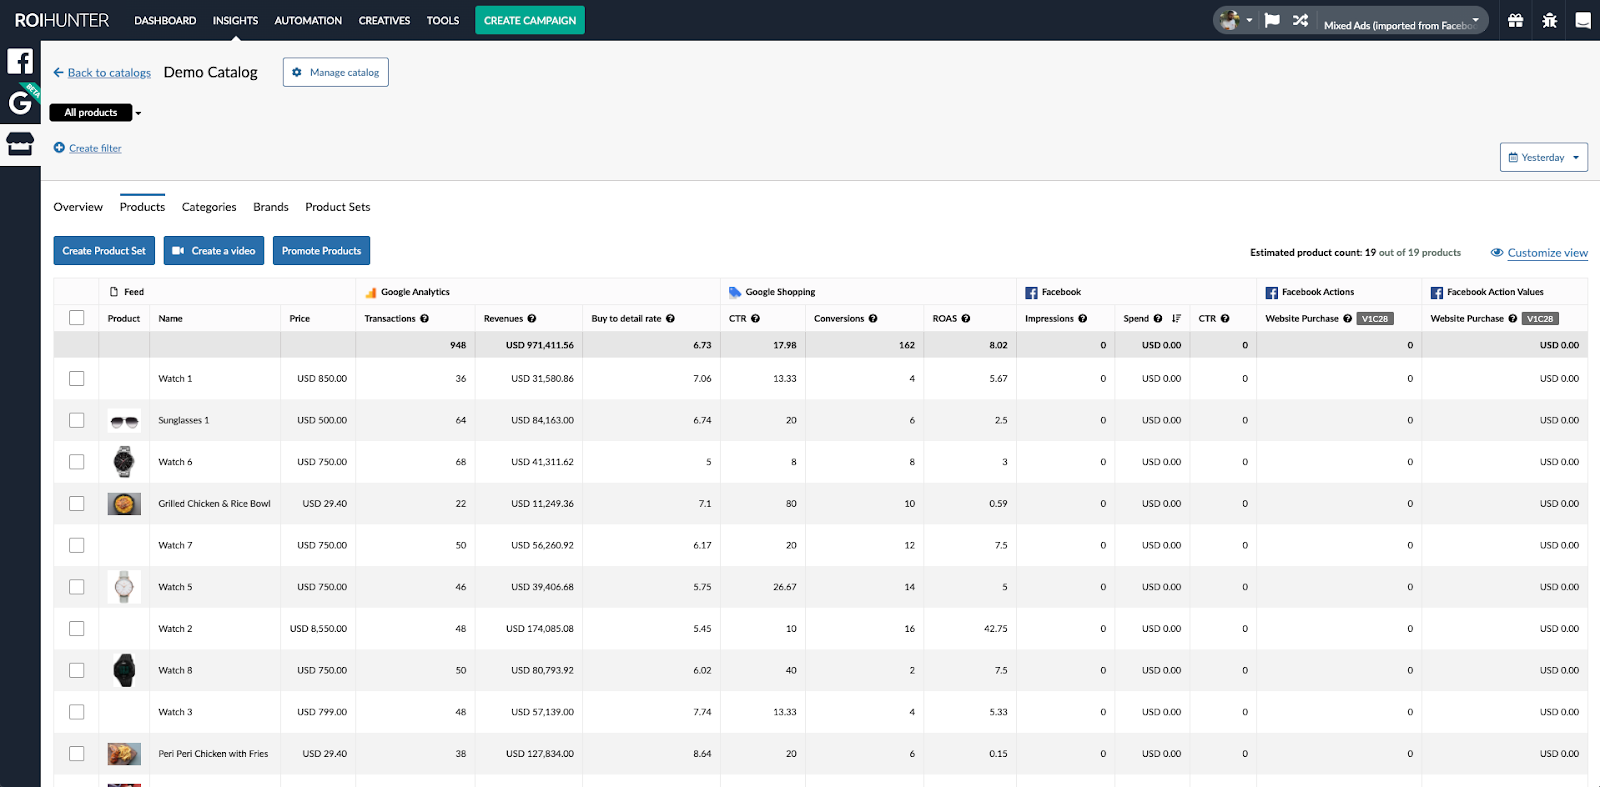
By using our Product Insights feature, clients are able to quickly create these product sets with items that share characteristics, based on the product-level data (high margin, chance of return, stock level etc.) integrated with their catalog.
When we launched Product Insights early last year, the idea was to help advertisers shift their train of thought from just ‘How do I improve my campaign performance?’ to ‘How do I leverage my product data to profitably run my campaigns and business?’.
In the days following the launch, we saw near immediate adoption of the feature. Many clients in our portfolio, including marquee clients like AVON, SportsDirect, and Al Futtaim, have seen their KPIs scale to new heights with Product Insights, which positively influenced their bottom line.
Today, we’re excited to say that about 45% of our clients are running campaigns that use Product Insights.

At the end of the day though, these strategies all involve the creation of separate product sets with their own bids and budgets. Now, this is a great way to make certain your promotions are for the items you want promoted, but having multiple campaigns running at the same time can be a major headache.
This is why ROI Hunter created the Catalog Overview Dashboard.
Introducing: The Catalog Overview Dashboard

After collecting and considering feedback from our partners, clients, and colleagues, we found that some clients were having difficulty knowing where to start when reviewing their metrics. In order to address this, we’ve created the Overview Dashboard.
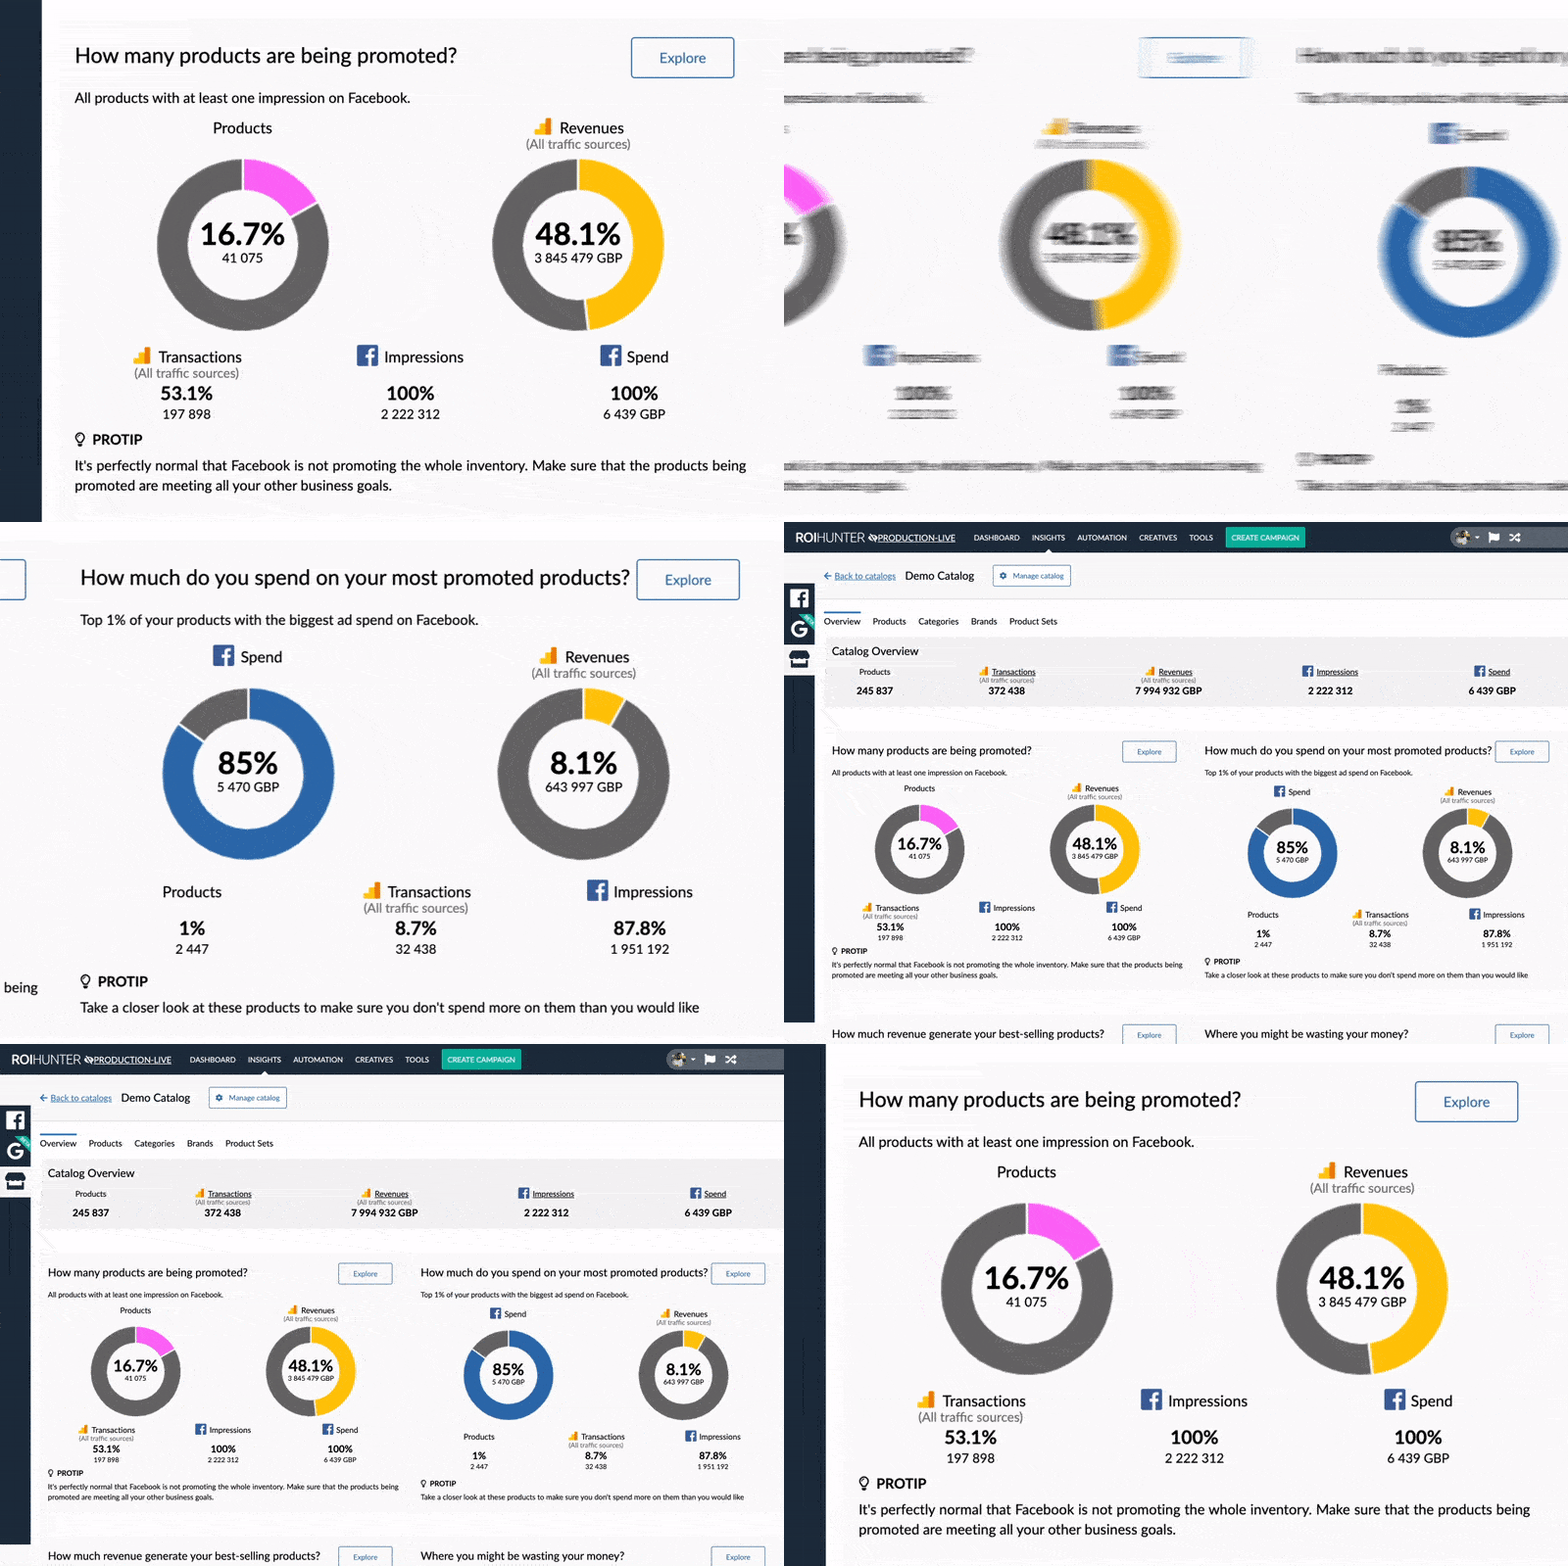
The Overview Dashboard is a brand new addition to the Product Insights module on ROI Hunter. The dashboard helps clients to do a quick status check on the performance of their products, and answers the most pressing questions they have about their inventory using easy-to-understand visualizations of their product data.
Initially, this dashboard is intended to help users understand the following about their inventory:
- Percentage of products that are actively being promoted
- Ad expenditure on products promoted the most
- Revenue generated by bestsellers
- Percentage of products that don’t generate revenue
- Percentage of products that aren’t promoted enough, despite bringing in a lot of revenue
For each of these options, users can explore, drill-down, and find out more about the products that come under the purview of these questions. Eventually, clients can become more comfortable using this information to take necessary actions, including (but not limited to) creating new product sets, or excluding poorly performing products from their campaigns. Please note that initially, there will be no option to modify these questions or the data in the dashboards.
So, What's Next?
The possibilities don’t end here. We are working hard to bring many more features to the foreground to help users take full advantage of their product data, including (but not limited to):
- A customization option for the dashboard with custom metrics, filters, and strategies
- Product category performance charts
- Exporting and sharing options
If you’re interested in learning more about how Product Insights works to increase profitability, take a look at our Product Performance Management (PPM) platform page, or click here to schedule a talk about your company’s specific pain points.
The Overview Feature is currently made available to clients upon request. If you are an interested client, please reach out to us via Support or contact your CSM to receive access, and let us know your thoughts, comments, and feedback.


